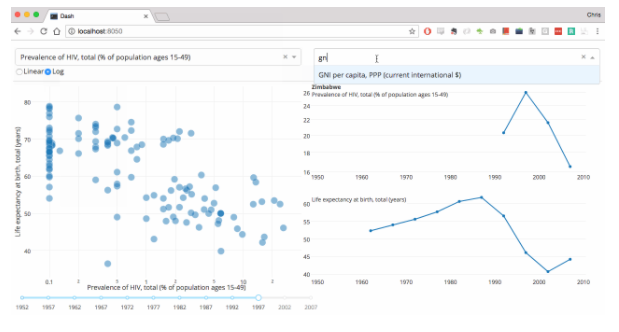
Dash
是建立数据分析性应用的 Python 框架,使用它不需要直接使用 JavaScript。基于 Plotly.js、React 和 Flask,
Dash
可以直接结合你的数据分析代码,构建酷炫的 UI Web 应用。
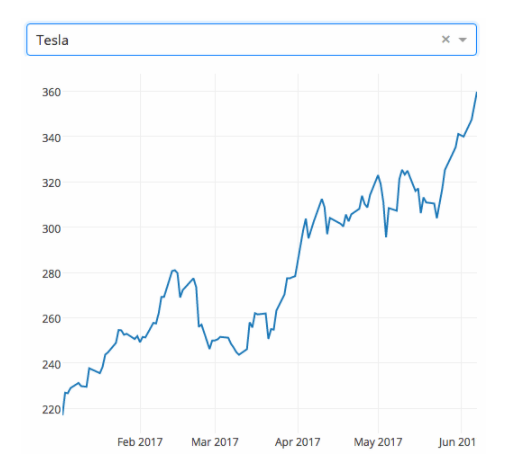
如上是只有 43 行 Python 代码构建的应用,通过 Pandas 加载 Google Finance 的数据,并使用 Dash 进行可视化。
代码演示:
import dash
from dash.dependencies import Input, Output
import dash_core_components as dcc
import dash_html_components as html
from pandas_datareader import data as web
from datetime import datetime as dt
app = dash.Dash('Hello World')
app.layout = html.Div([
 dcc.Dropdown(
 id='my-dropdown',
 options=[
 {'label': 'Coke', 'value': 'COKE'},
 {'label': 'Tesla', 'value': 'TSLA'},
 {'label': 'Apple', 'value': 'AAPL'}
 ],
 value='COKE'
 ),
 dcc.Graph(id='my-graph')
], style={'width': '500'})
@app.callback(Output('my-graph', 'figure'), [Input('my-dropdown', 'value')])
def update_graph(selected_dropdown_value):
 df = web.DataReader(
 selected_dropdown_value,
 'google',
 dt(2017, 1, 1),
 dt.now()
 )
 return {
 'data': [{
 'x': df.index,
 'y': df.Close
 }],
 'layout': {'margin': {'l': 40, 'r': 0, 't': 20, 'b': 30}}
 }
app.css.append_css({'external_url': 'https://codepen.io/chriddyp/pen/bWLwgP.css'})
if __name__ == '__main__':
 app.run_server()
呈现效果:
上面只给大家展示了很少一部分的代码,却给大家演示出来非常详细的内容,可见这个工具很好使用,大家可以结合自己现在所用的工具,对比看下选择使用哈~