
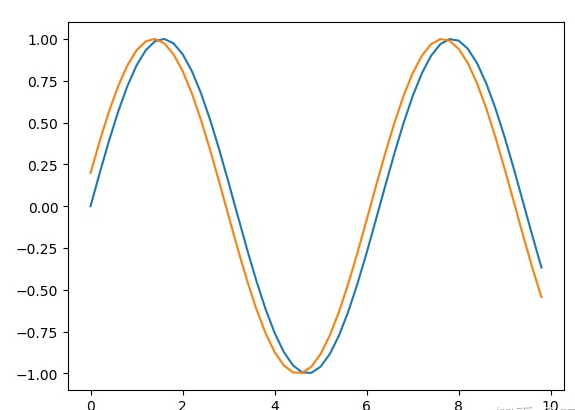
我们尝试画一两个不同相位的正弦曲线试试,并添加图例,标题等,输入下面的神秘代码,可以看出两条正弦曲线出现了,注意我们在代码里并没有定义两条曲线的颜色,但是python还是很贴心的给我们自动的用不同的颜色画出了曲线。
import matplotlib.pyplot as plt
import numpy as np
x = np.arange(0, 10, 0.2)#x的范围0-10 步长0.2
y1 = np.sin(x)#计算y1
y2 = np.sin(x+0.2)#计算y2
fig, ax = plt.subplots()#创建一个figure
ax.plot(x, y1, label='y1')
ax.plot(x, y2, label='y1')
plt.show()
这个图虽然画出来了,但是你仔细品,感觉是不是不够丰富,那你再试试下面这段代码,这下画出来的图是不是有内味了^_^。
import matplotlib.pyplot as plt
import numpy as np

x = np.arange(0, 10, 0.2)#x的范围0-10 步长0.2
y1 = np.sin(x)#计算y1
y2 = np.sin(x+0.2)#计算y2
fig, ax = plt.subplots()#创建一个figure
####plot
ax.plot(x, y1, label='y1')
ax.plot(x, y2, label='y2')
####展示图例 legend loc=是用来定义图例的位置的,还有很多选择,大家可以自己尝试
ax.legend(loc = 'upper right')
####定义标题
fig.suptitle('sin curve')
####定义x, y轴的名称
ax.set_xlabel('x')
ax.set_ylabel('y')
####定义x,y轴的显示范围
ax.set_xlim(0, 10)
ax.set_ylim(-1,1)
####打开网格
ax.grid(True)
plt.show()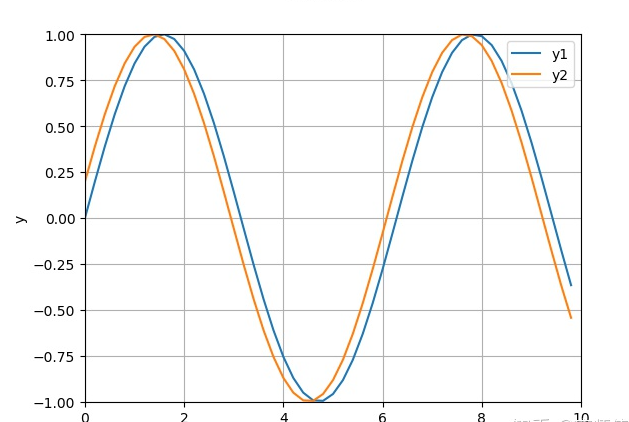
以上就是python中用matlibplot画正弦曲线的方法。更多Python学习推荐:PyThon学习网教学中心。


